 Skip to content
If you are starting your journey in the stock market, learning candlestick patterns for beginners is one of the most powerful skills you can develop. Candlestick charts help traders visually understand price movement, market psychology, and possible future trends. Whether you trade stocks, indices, or derivatives, candlestick analysis is a foundation skill.
In this complete step-by-step guide, you’ll learn what are candlestick patterns, how to read candlestick charts, key bullish and bearish candlestick patterns, and a practical candlestick trading strategy for beginners.
What Are Candlestick Patterns?
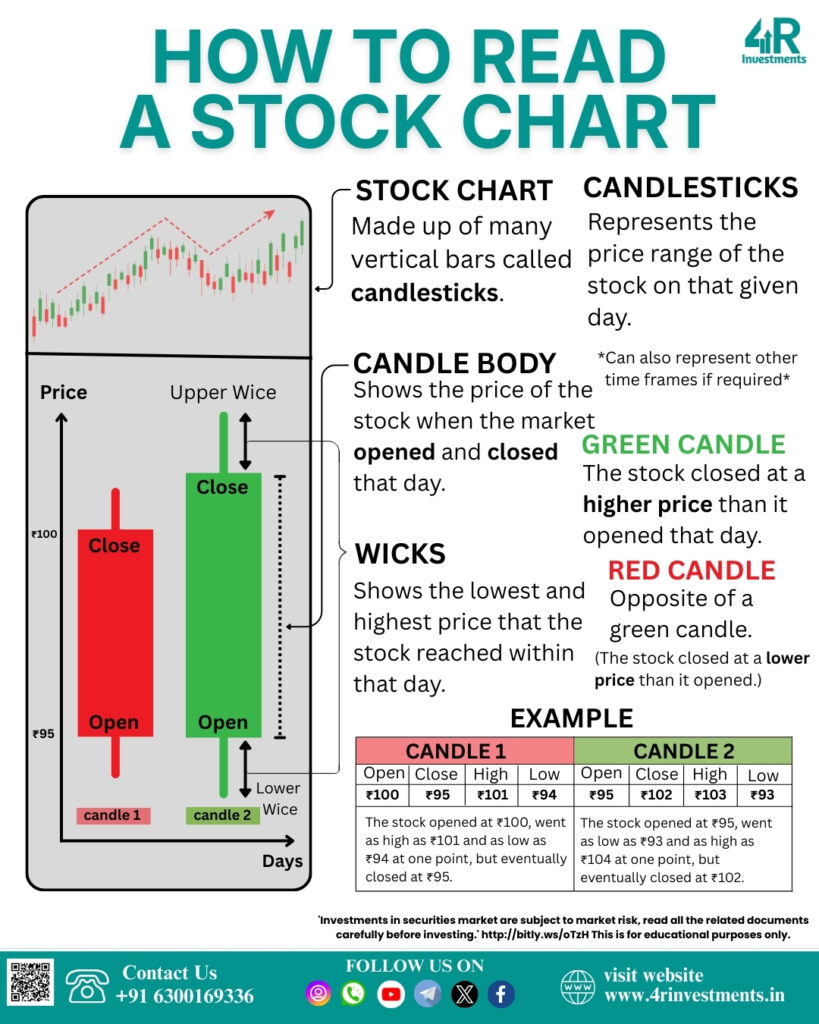
Candlestick patterns for beginners are visual formations created by price movements within a specific time period. Each candlestick shows four important data points:
- Open price
- High price
- Low price
- Close price
This format makes it easier to understand who is in control — buyers or sellers.
When traders ask what are candlestick patterns, the simple answer is: they are price action signals that help predict potential trend reversals or trend continuations. These patterns repeat because market psychology repeats.
Candlestick patterns are widely used because they are simple, visual, and effective across timeframes.
How to Read Candlestick Charts (Step-by-Step)
Understanding how to read candlestick charts is easier than most beginners think.
Each candle has two main parts:
1️⃣ Body
- Shows difference between open and close
- Green (or white) = price closed higher → bullish
- Red (or black) = price closed lower → bearish
2️⃣ Wicks (Shadows)
- Show highest and lowest prices during that time
- Long upper wick = selling pressure
- Long lower wick = buying pressure
For anyone learning candlestick patterns for beginners, always observe:
- Candle size
- Wick length
- Position near support/resistance
- Trend direction before pattern forms
Context matters more than just pattern shape.
Bullish and Bearish Candlestick Patterns You Must Know
Learning bullish and bearish candlestick patterns helps traders spot potential turning points. Here are some of the most useful ones.
✅ Bullish Patterns (Possible Upward Move)
- Hammer
- Bullish Engulfing
- Morning Star
- Piercing Pattern
These patterns suggest buyers are gaining control after a decline.
🔻 Bearish Patterns (Possible Downward Move)
- Shooting Star
- Bearish Engulfing
- Evening Star
- Dark Cloud Cover
These suggest sellers are taking control after a rise.
For candlestick patterns for beginners, start by mastering just 5–6 patterns and recognizing them clearly on charts.
Most Reliable Candlestick Patterns (High Probability Setups)
Many traders ask about the most reliable candlestick patterns. Reliability increases when patterns appear near key levels and with volume confirmation.
Some of the most reliable candlestick patterns include:
- Engulfing patterns
- Hammer at support
- Shooting star at resistance
- Morning star / evening star
- Doji with breakout confirmation
No pattern is 100% accurate — but when combined with trend, support/resistance, and volume, probability improves significantly.
This is why professional traders never use candlestick patterns for beginners in isolation.
Candlestick Trading Strategy for Beginners
Here is a simple candlestick trading strategy for beginners you can start using immediately.
Step 1 — Identify Trend
Use a higher timeframe to check if market trend is up, down, or sideways.
Step 2 — Mark Support & Resistance
Draw key levels where price reacted earlier.
Step 3 — Wait for Pattern at Key Level
Look for bullish and bearish candlestick patterns near those zones.
Step 4 — Confirm with Volume
Higher volume = stronger signal.
Step 5 — Use Stop Loss
Always place stop loss below/above pattern structure.
Step 6 — Risk Management
Risk only 1–2% per trade.
This structured approach makes candlestick patterns for beginners practical and safer.
Common Mistakes Beginners Must Avoid
When learning how to read candlestick charts, beginners often make these mistakes:
❌ Trading every pattern blindly
❌ Ignoring trend direction
❌ No stop loss
❌ Overtrading small timeframes
❌ No confirmation indicators
Remember — candlestick patterns for beginners are tools, not guarantees.
Why Candlestick Patterns Matter for New Traders
Understanding candlestick patterns for beginners gives you:
✔ Better entry timing
✔ Better exit decisions
✔ Market psychology insight
✔ Visual clarity
✔ Structured trade setups
This is why candlestick study is included in almost every professional trading curriculum.
Start Your Trading Journey with Expert Support
If you want guided support in learning market basics, pattern reading, and practical strategies, connect with 4R Investments — helping investors and traders build knowledge-driven portfolios.
🎯 Get a FREE Demat Account and start your market journey today.
Contact Details — 4R Investments
📞 Phone: 6300169336
📧 Email: contact@4rinvestments.in
📍 Office: 3-1-309/310, Tara Kaushalya Nivas, Nimboliadda, Kachiguda, Hyderabad-500027
🌐 Website: https://4rinvestments.in/
Final Thoughts
Mastering candlestick patterns for beginners is not about memorizing shapes — it is about understanding price behavior. Learn what are candlestick patterns, practice how to read candlestick charts, identify bullish and bearish candlestick patterns, focus on most reliable candlestick patterns, and follow a rule-based candlestick trading strategy for beginners.
With discipline and practice, candlestick reading can become one of your strongest trading skills.
Disclaimer
This content is for educational purposes only and not investment advice.
Stock market investments are subject to market risks.
Please consult a qualified financial advisor before making trading decisions.
